Derivatives-linked securities disclosures scattered across securities firms, as one comparable table
Automatically gathers ELS·ELB product information from each securities firm, splits product structures written in sentences into columns for maturity, period, and early redemption conditions, and puts them in one table.
Product comparison
Before
Checked separately per securities firm
After
Compared by condition in one table
Background
Derivatives-linked securities have different conditions from product to product: how many years to maturity, how often early redemption is evaluated, what the underlying assets are, and how far the price must fall to enter the loss zone all vary. And those conditions are scattered across each securities firm’s disclosure page.
What we saw on site
To compare, you had to open each securities firm’s website one by one. The page structure also differs between firms. Even after gathering them all, comparison wasn’t actually possible, because the conditions are written in sentences.
만기3년 조기상환형 (85-85-80-80-75-70) KI45
To a person this is one line, but it contains a 3-year maturity, a 6-month period, the per-installment early redemption thresholds, and Knock-In 45 all at once. Unless it is split into items, it still has to be read by eye even once it is in a table.
The problem we defined
What was harder than collecting was turning sentences into columns. Only then does one sort, one filter give a comparison by condition. Otherwise the effort of opening files is gone, but the effort of comparing remains.
What we built
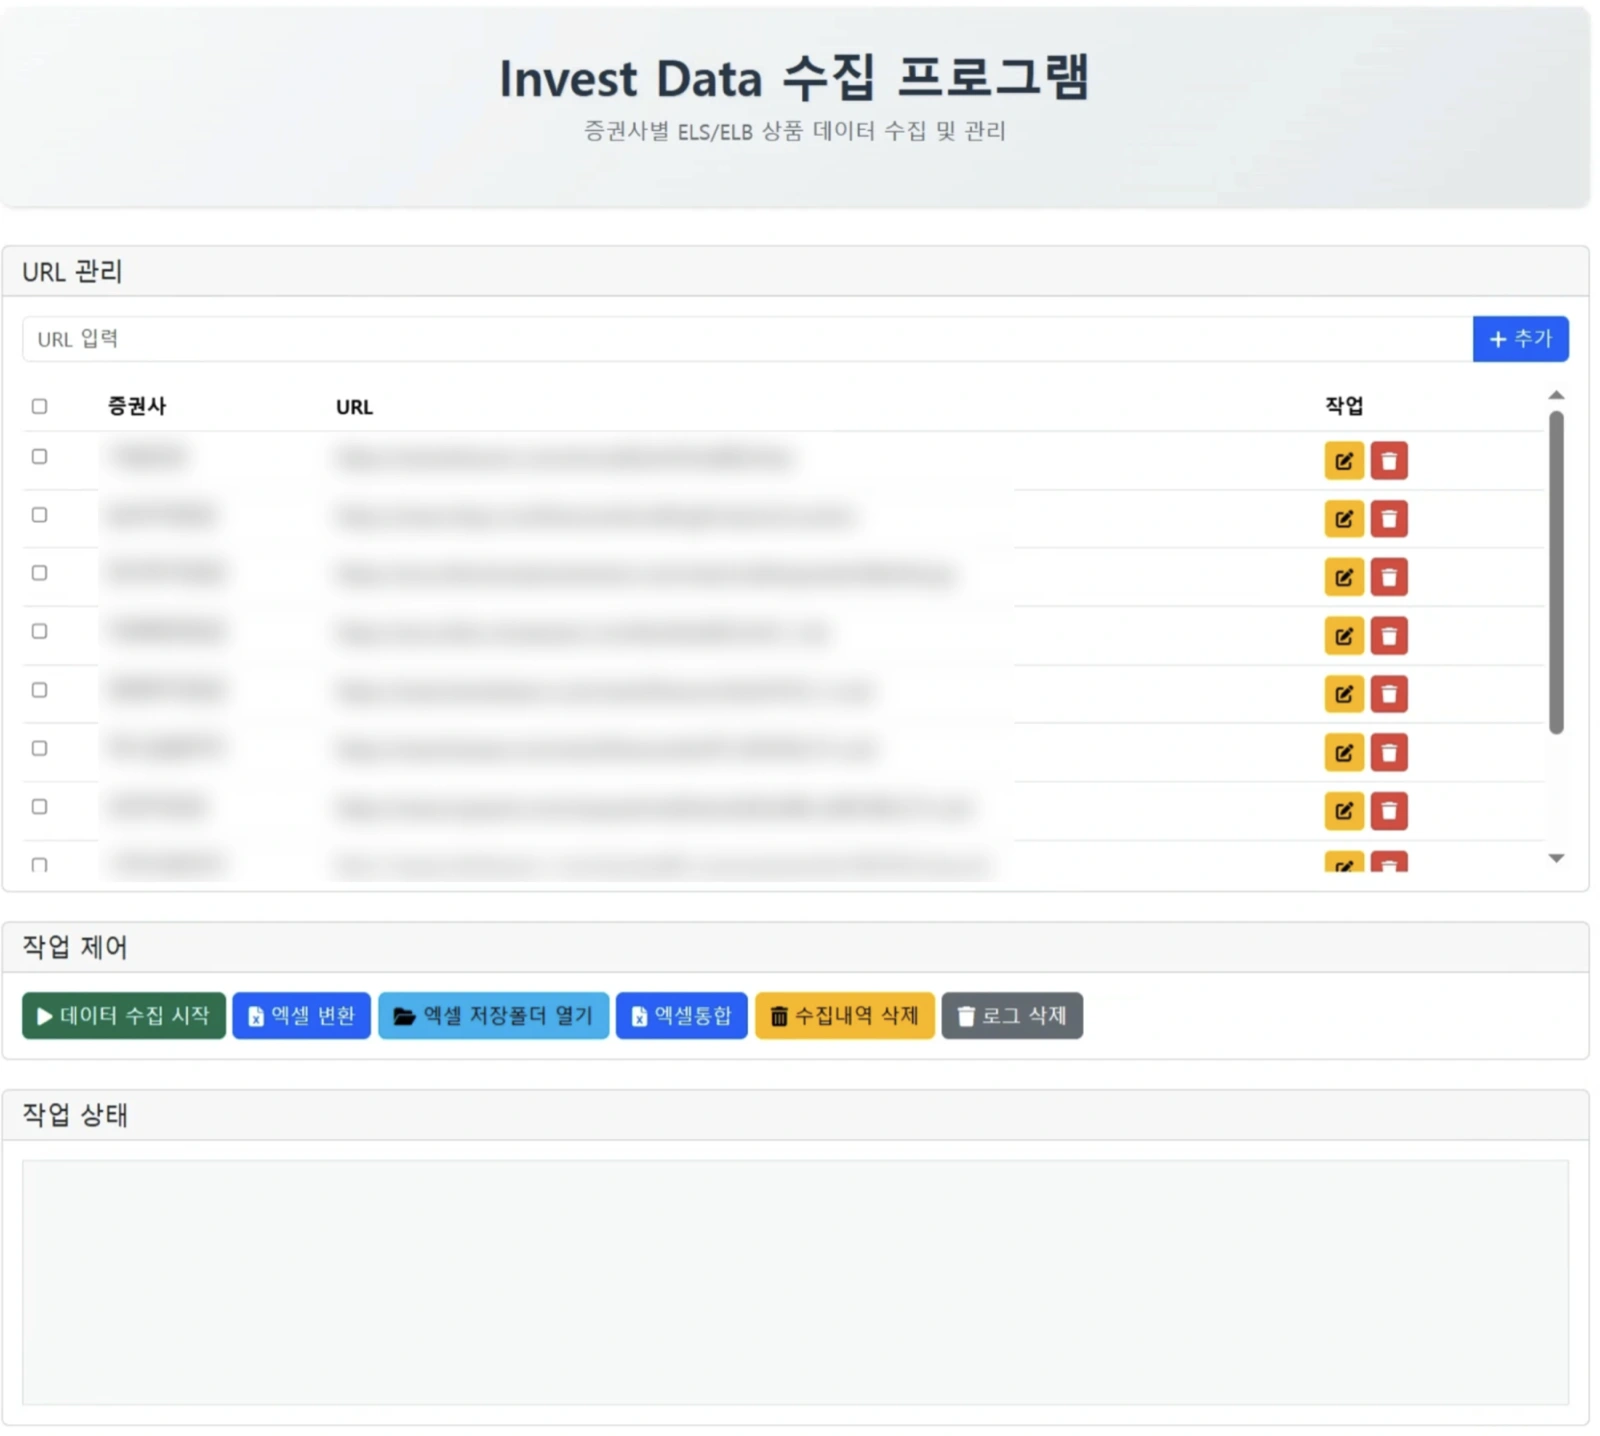
- Collection address management per securities firm — register and edit which page of which securities firm to pull from, on the screen. When a disclosure page address changes, only that line needs fixing
- Selective collection — scan all registered securities firms, or pick just the ones you need
- Structure string parsing — extract maturity in years, redemption period, Knock-Out, and Knock-In from the product structure notation into separate columns
- Underlying asset separation — split up to three assets into columns, whether index or individual stocks
- Excel conversion and consolidation — merge the per-firm results into one file. A button to open the save folder right away means no hunting for results
- Job status display — shows how far collection has gone, on the screen
Result
Built and delivered in about two weeks. 27 products ended up in one table, and currency, early redemption date, maturity date, yield, underlying assets, Knock-Out, and Knock-In are all in the same columns. One sort gives you a condition-by-condition comparison.
Other work built the same way is collected at web data collection.
Other work on the same topic is collected at data analysis.
Sources
Running screen of the delivered program