19,889 investment projects on the Indian government portal, as one table of 41 fields
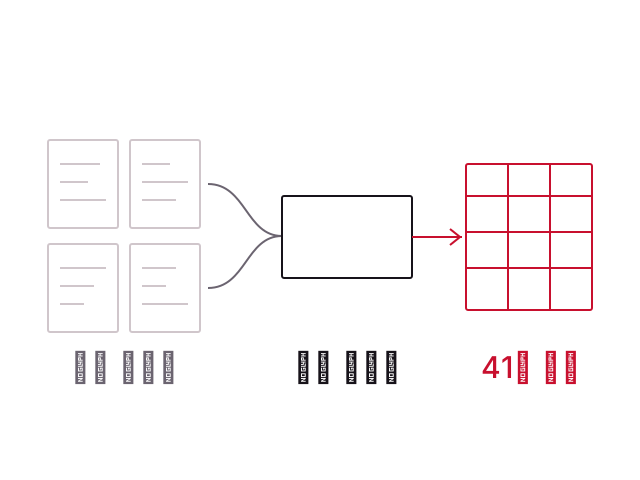
Gathered every investment project from the government portal where investment projects across India are listed, and rearranged the scattered detail into one table of 41 fields. Handed over as a runnable file the person in charge can use.
Projects collected
Before
Checked per project
After
19,889 projects · 41 fields
Background
India’s investment project information is published on India Investment Grid, which is run by the government. The problem is that it is scattered, one page per project. To see how much was moving in which sector in which state, you had to open the pages one by one.
What we saw on site
What the research needed was not individual projects but the distribution of the whole. The portal, however, is built around individual lookups, so to view by sector and by stage someone first had to transcribe everything by hand. Given the number of projects, that was a task that could not be started.
The problem we defined
Matching the fields was harder than collecting. Each project had different fields filled in, project costs mixed currencies and units, and values with the same meaning were stored under different names. To make one table, this difference had to be resolved first.
What we built
- Full project collection — gathered projects across 41 sectors without missing any
- Normalization into 41 fields — lined up scattered values such as sector, sub-sector, project stage, total project cost, state, implementation method, promotion type, and expected completion date into the same columns
- Delivered as a runnable file — handed over so the person in charge can run it without a Python environment
What we guarded against
Fetching this much is bound to fail partway. The problem is not that it fails, but whether you can find the failures later.
- Failed addresses are recorded separately — when a request breaks off or gets no response, the address is written to a separate file. Collection continues
- A script that re-fetches only that list — no need to rerun the whole thing from the start. The second collection targets only what failed
- Re-fetched results are kept with a date — what was filled in and when stays on record
- Fetched 12 at a time, with a timeout per request — one unresponsive item does not stop the whole run
Results
19,889 projects were organized into 41 fields. Among them, 19,087 had a confirmed total project cost.
By sector, roads and highways were the most at 4,180 projects, followed by water supply, sewerage and waste at 2,264, real estate at 1,480, health at 1,271, education at 954, and railways at 920. Project stages are split into 5 types, including under development, under implementation, and completed.
Other work built the same way is gathered under web data collection.
Sources
Delivered Excel output file