We tally by the same criteria what used to be compared by eye
Gathered data alone doesn't mean a judgment can be made. When item names differ and units differ, even after gathering, a person ends up scanning by eye and deciding by feel.
Public cases 8 · 2025–2026
Gathering and tallying are different jobs.
In one case, a manual consolidation that took over 4 hours dropped to within 1 minute. But more important than the time saved is that what people used to count differently is now counted by the same criteria. If the criteria waver, even speed can't be trusted.
-
We set the criteria first
Item names and units differ by platform. Adding them without aligning first means counting different things. We decide first what counts as the same, and write that rule in a document, not in code.
-
We only quantify what can be counted
Scores and ratings come only from countable items. Put uncountable things into a score, and the number looks like it replaced judgment — in fact it hides a hunch.
-
We split sentences into conditions
Things written as sentences, like product descriptions or disclosures, cannot be compared as they are. Split along axes such as maturity, period, and conditions, they sit side by side in one table.
-
We keep the evidence
You must be able to trace from the result numbers back to the source data. A table that can't be traced back gives you no way to find where it went wrong when it does.
What we built for you.
Each case shows the situation before it was commissioned, the result, and the actual screens. Some were used for academic purposes, like comment analysis for research.
-
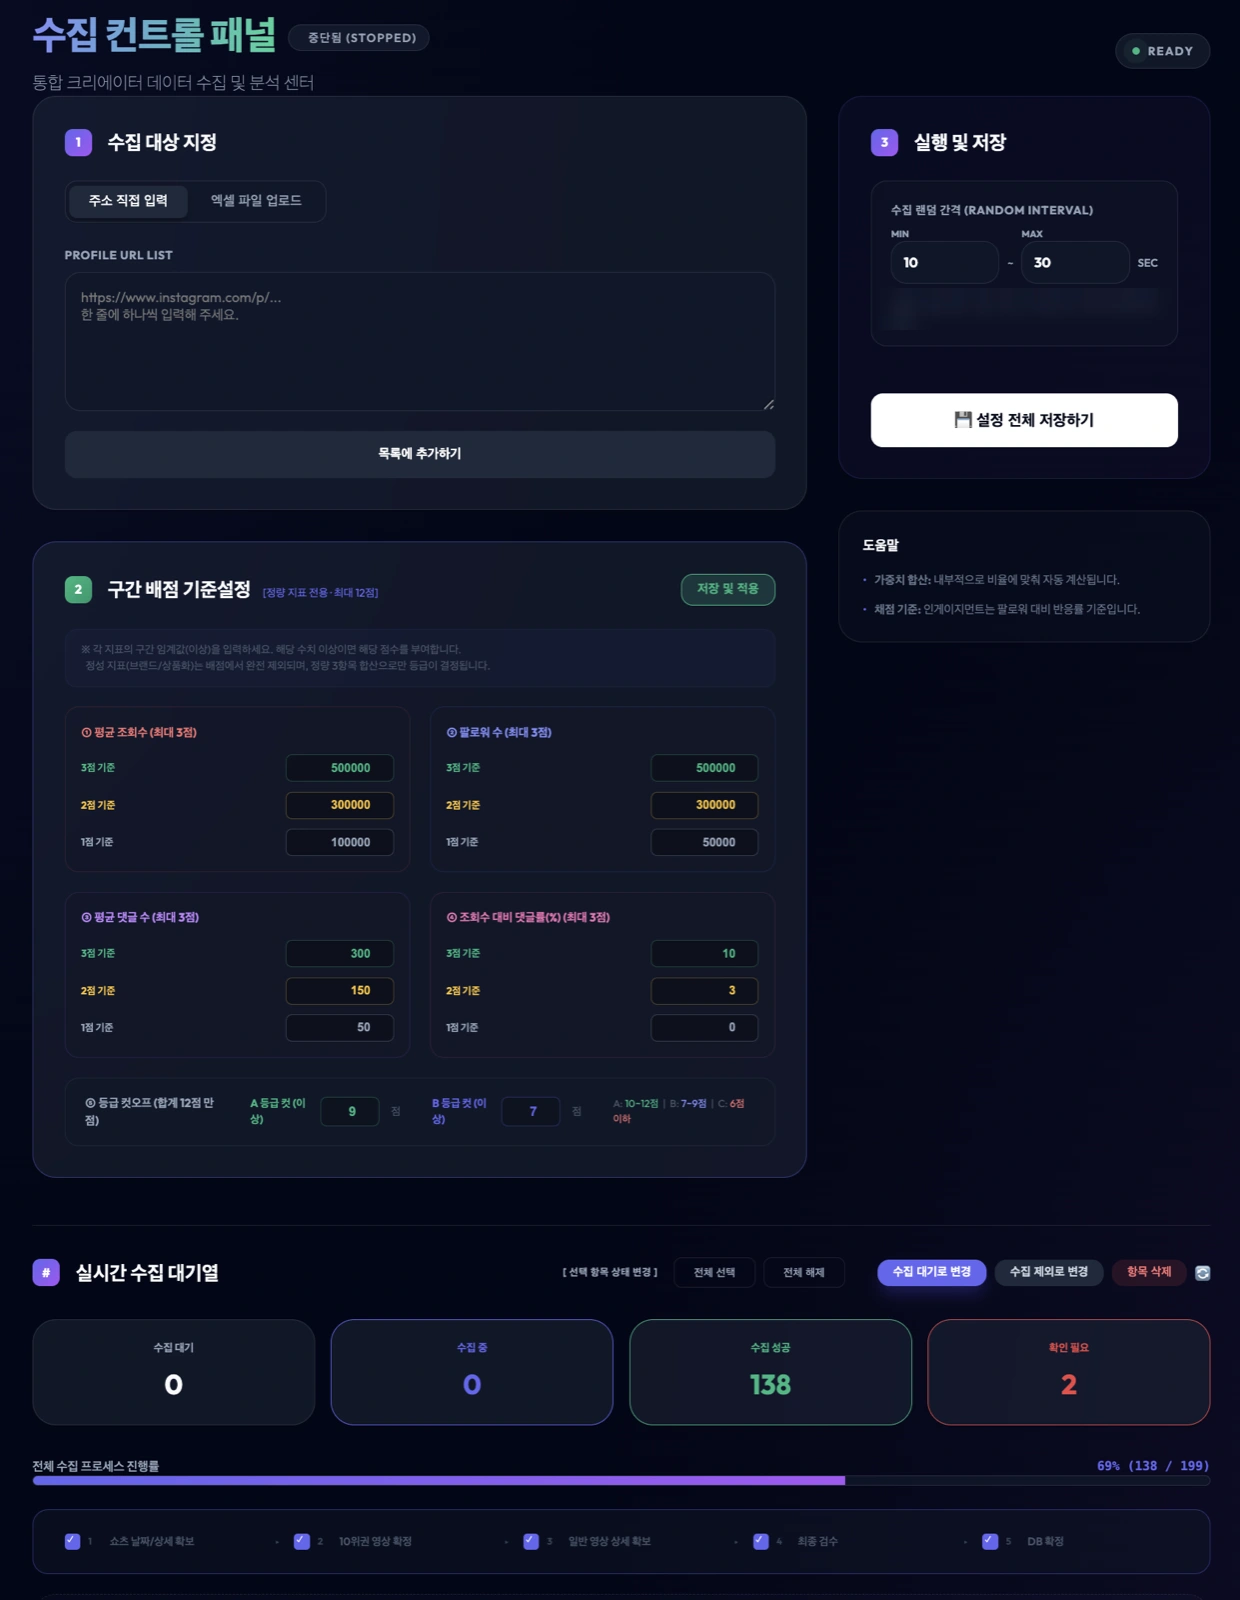
A collection and scoring system that stops you from picking creators by eye
Influencer profiles are collected automatically, scored with quantitative metrics alone, and divided into grades. The criteria judge — not the picker's gut feel.
Creator screening Metrics compared by a person from 4 quantitative items summed · grade computed to
-
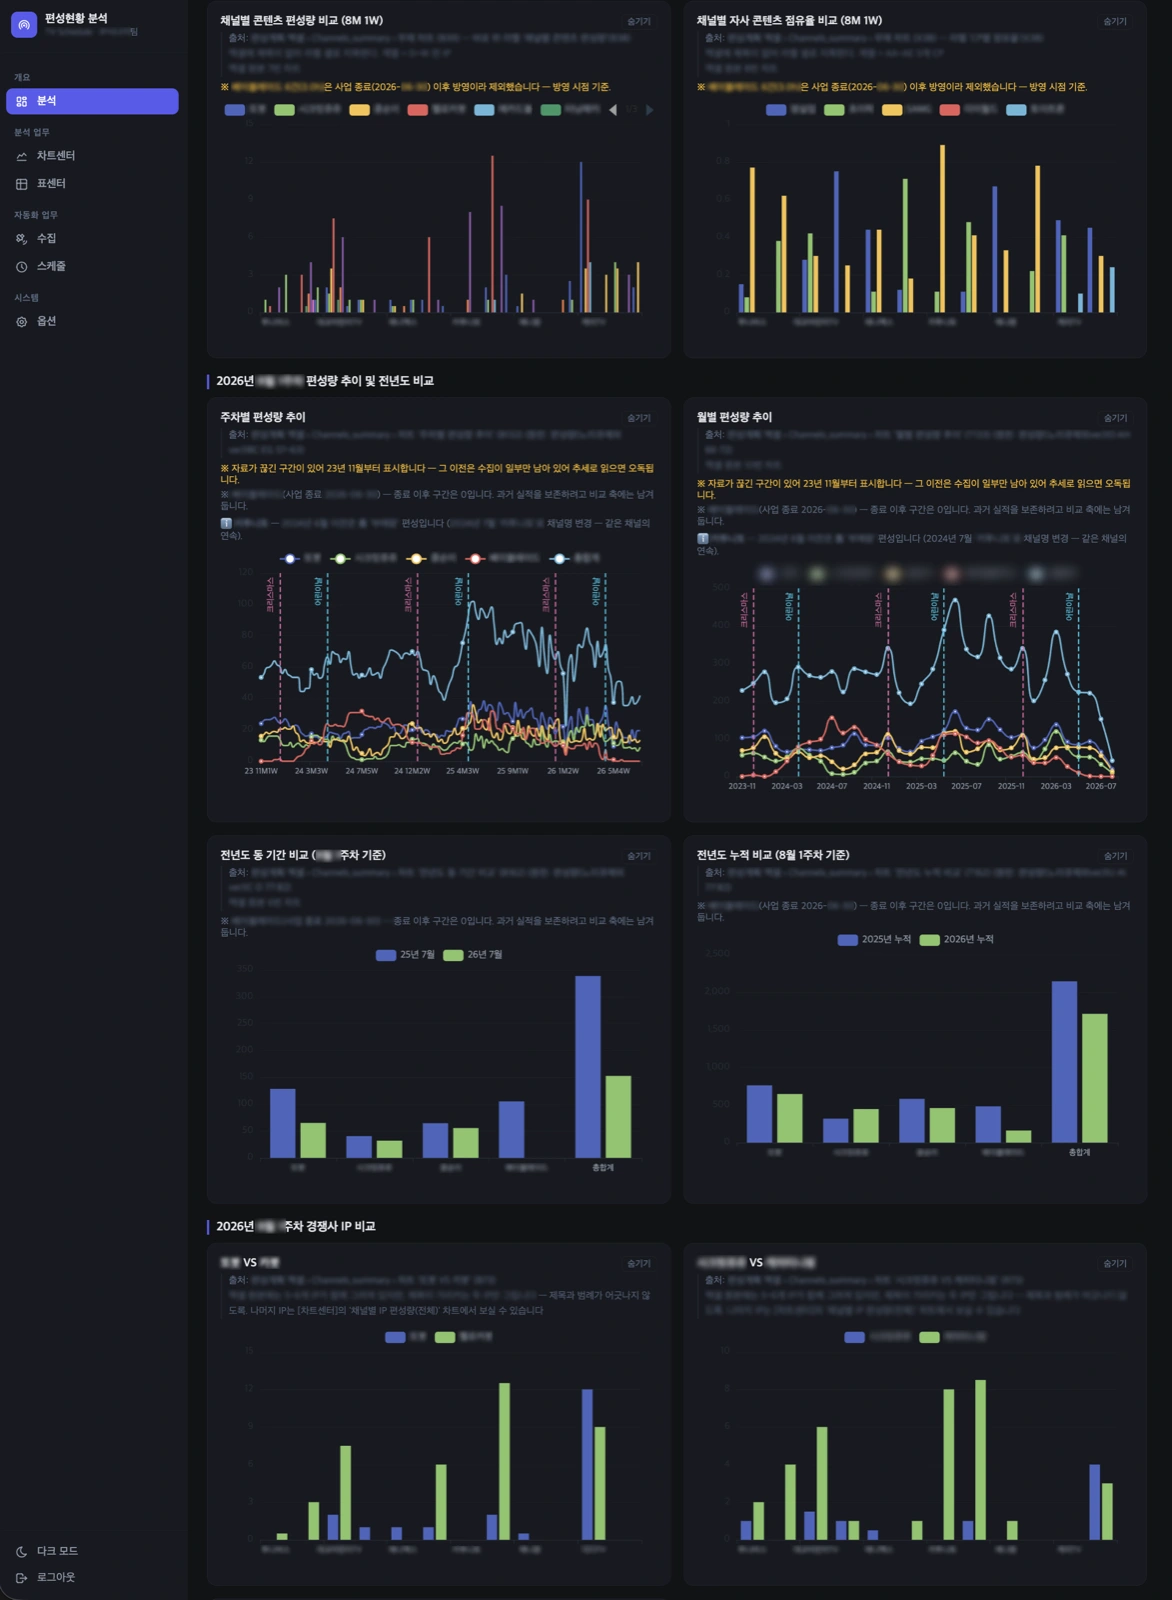
Even when the schedule changes, we don't rebuild the charts
Replaced the work of hand-collecting schedule tables and building charts in Excel with a structure that collects them automatically and shows them directly on a screen. The work that used to be redone from scratch every time the schedule changed went from 4 hours or more to within 1 minute.
Manual working time 4 hours or more from Within 1 minute to
-
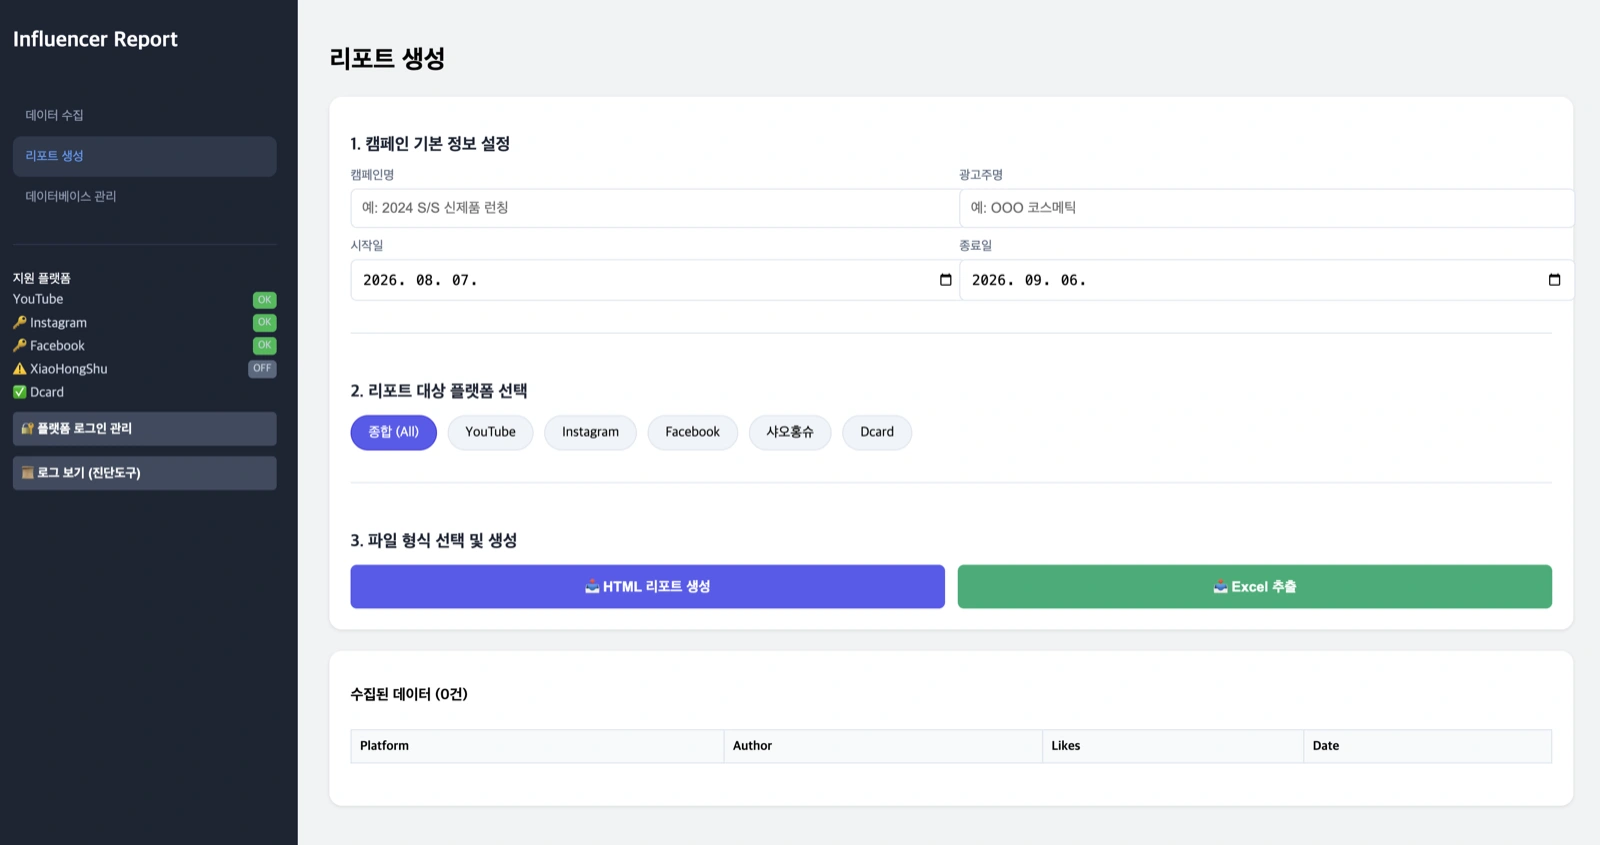
Influencer performance scattered across 5 platforms, condensed into one advertiser report
A Python desktop app another vendor started and stopped was rebuilt as a Chrome extension that runs inside the browser where the user is already logged in. All five platforms, where no values had been captured, opened up.
Platforms collecting correctly 1 of 5 from 5 platforms to
-
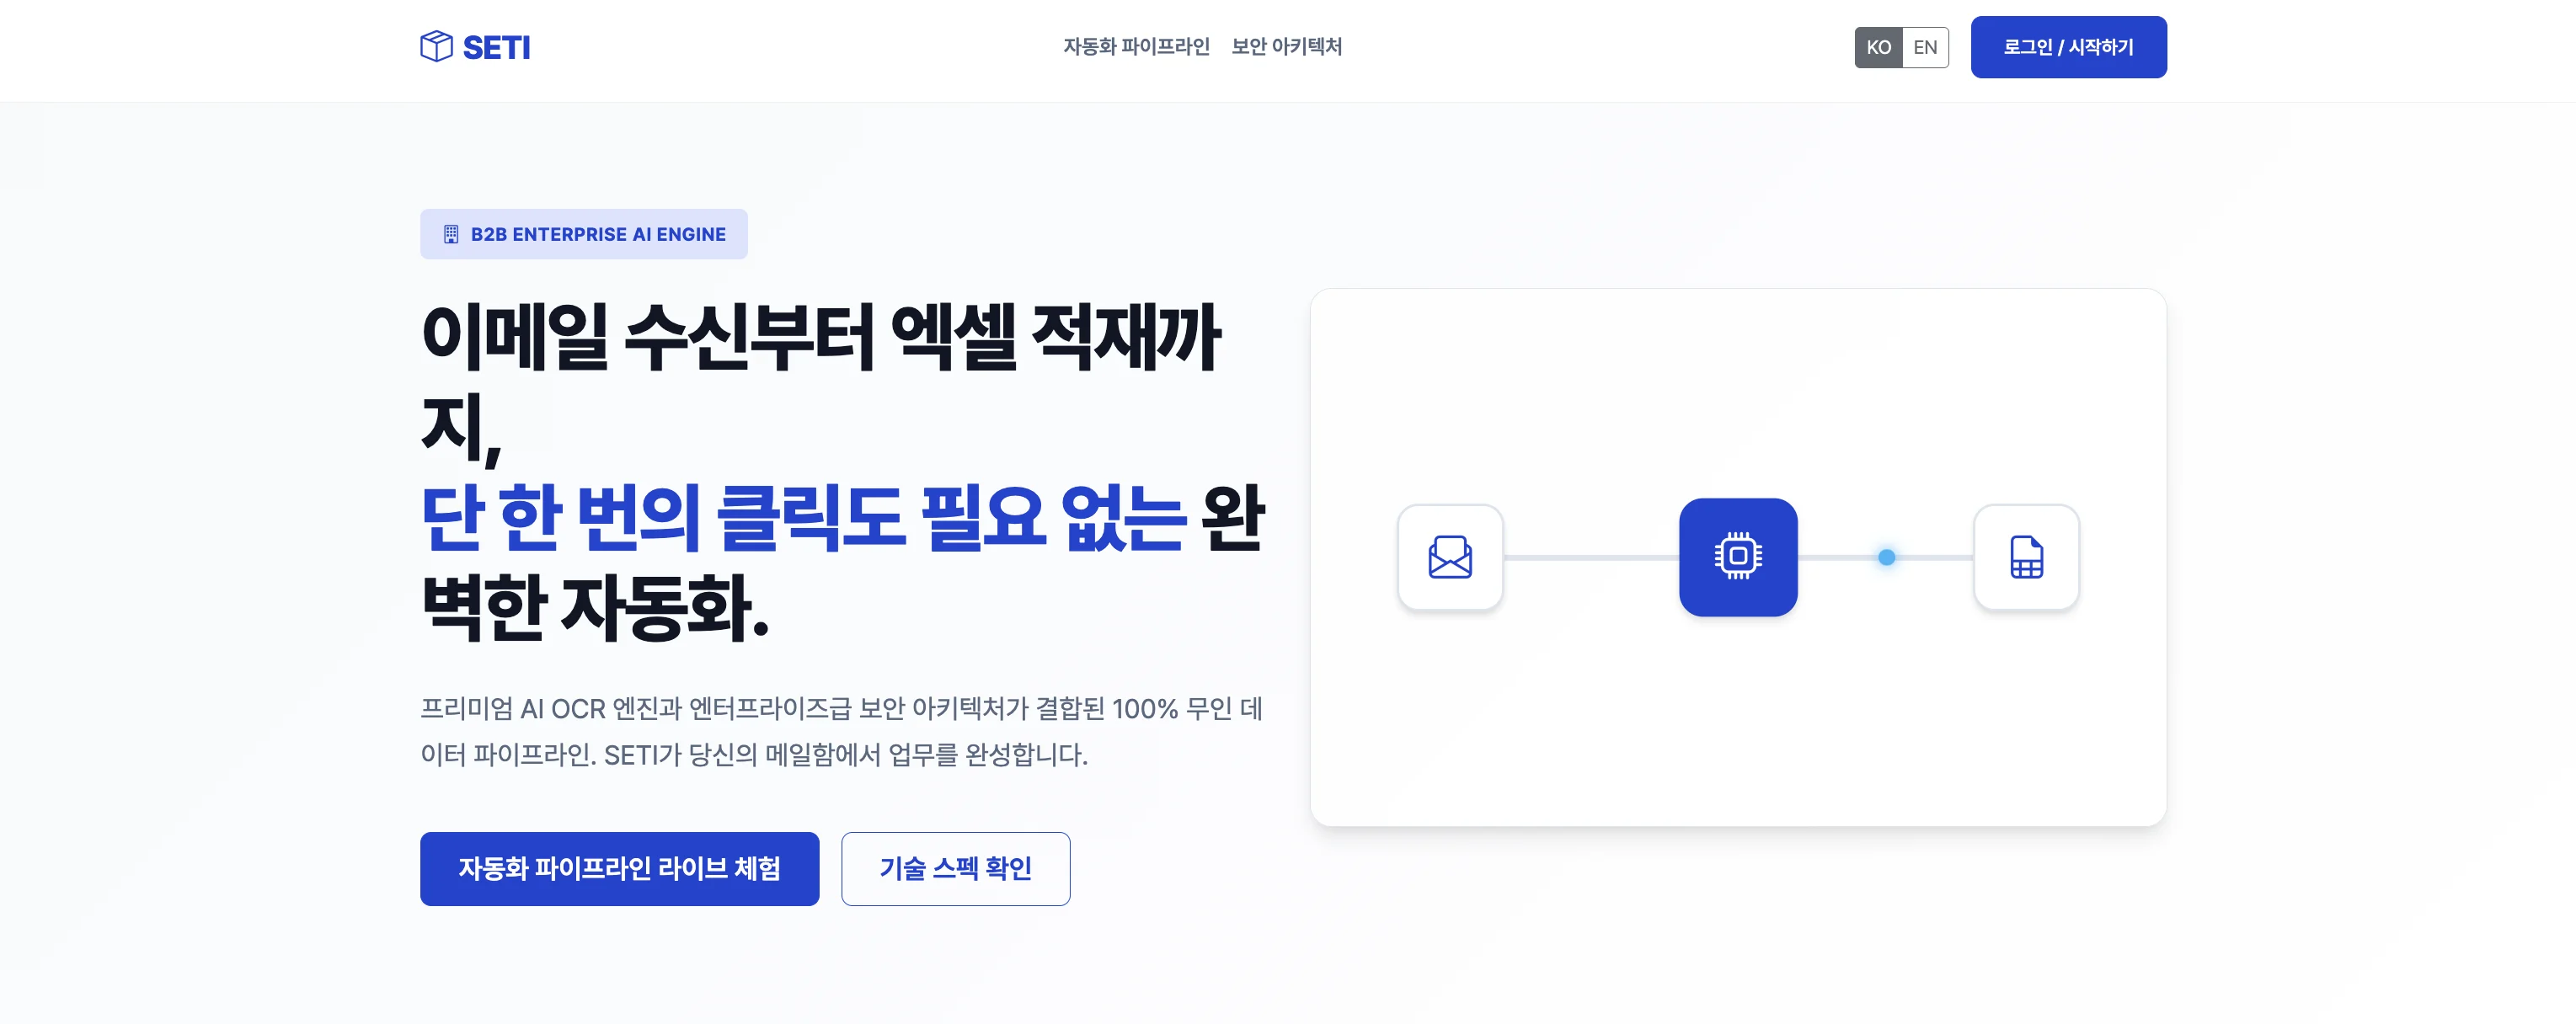
A document that arrives by email becomes a row in Excel, with no human hand
It watches the inbox, reads the text out of attached PDFs and images, and an AI splits that text into fields and delivers it to Excel. The form is defined by whoever sends it.
Service in operation Deployed 2026.01 from Pilot service · running free of charge to
-
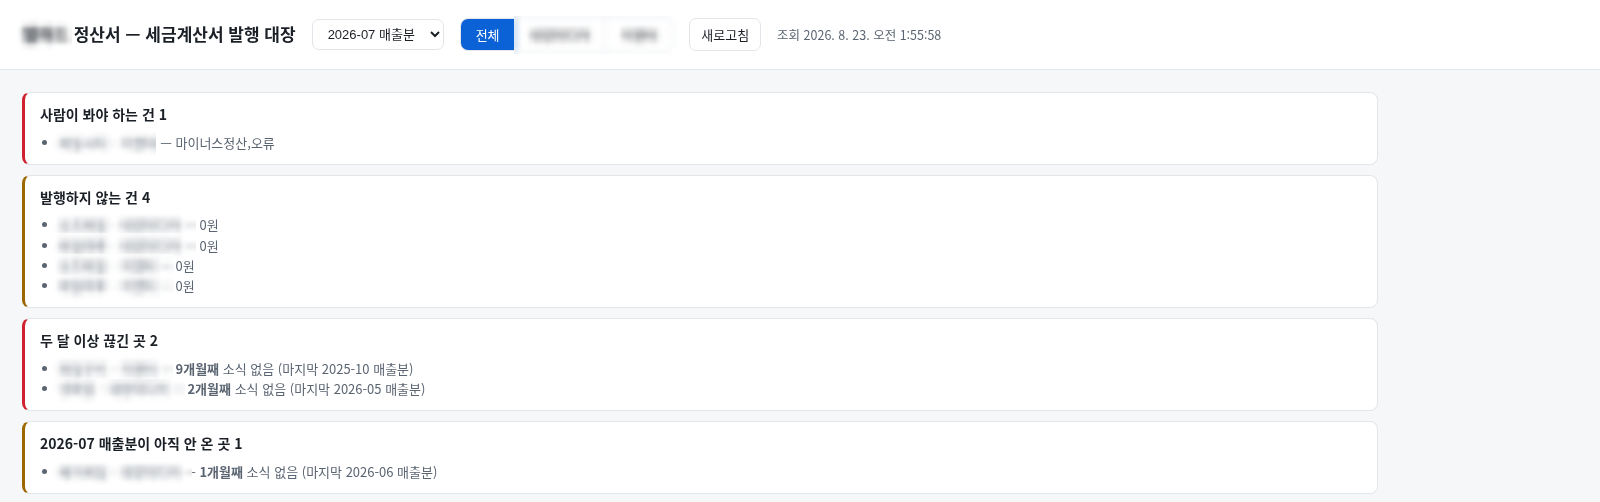
Cut tax invoice issuance from a full day for one person to one hour
Every morning, it reads the settlement ledgers that 26 vendors send by email on its own and builds the register of who should be invoiced and for how much. Opening each email, downloading attachments, and transcribing amounts by hand are gone — the only human step left is pressing the issue button.
From checking settlement ledgers to the tax invoice issuance register One person all day from 1 hour to
-
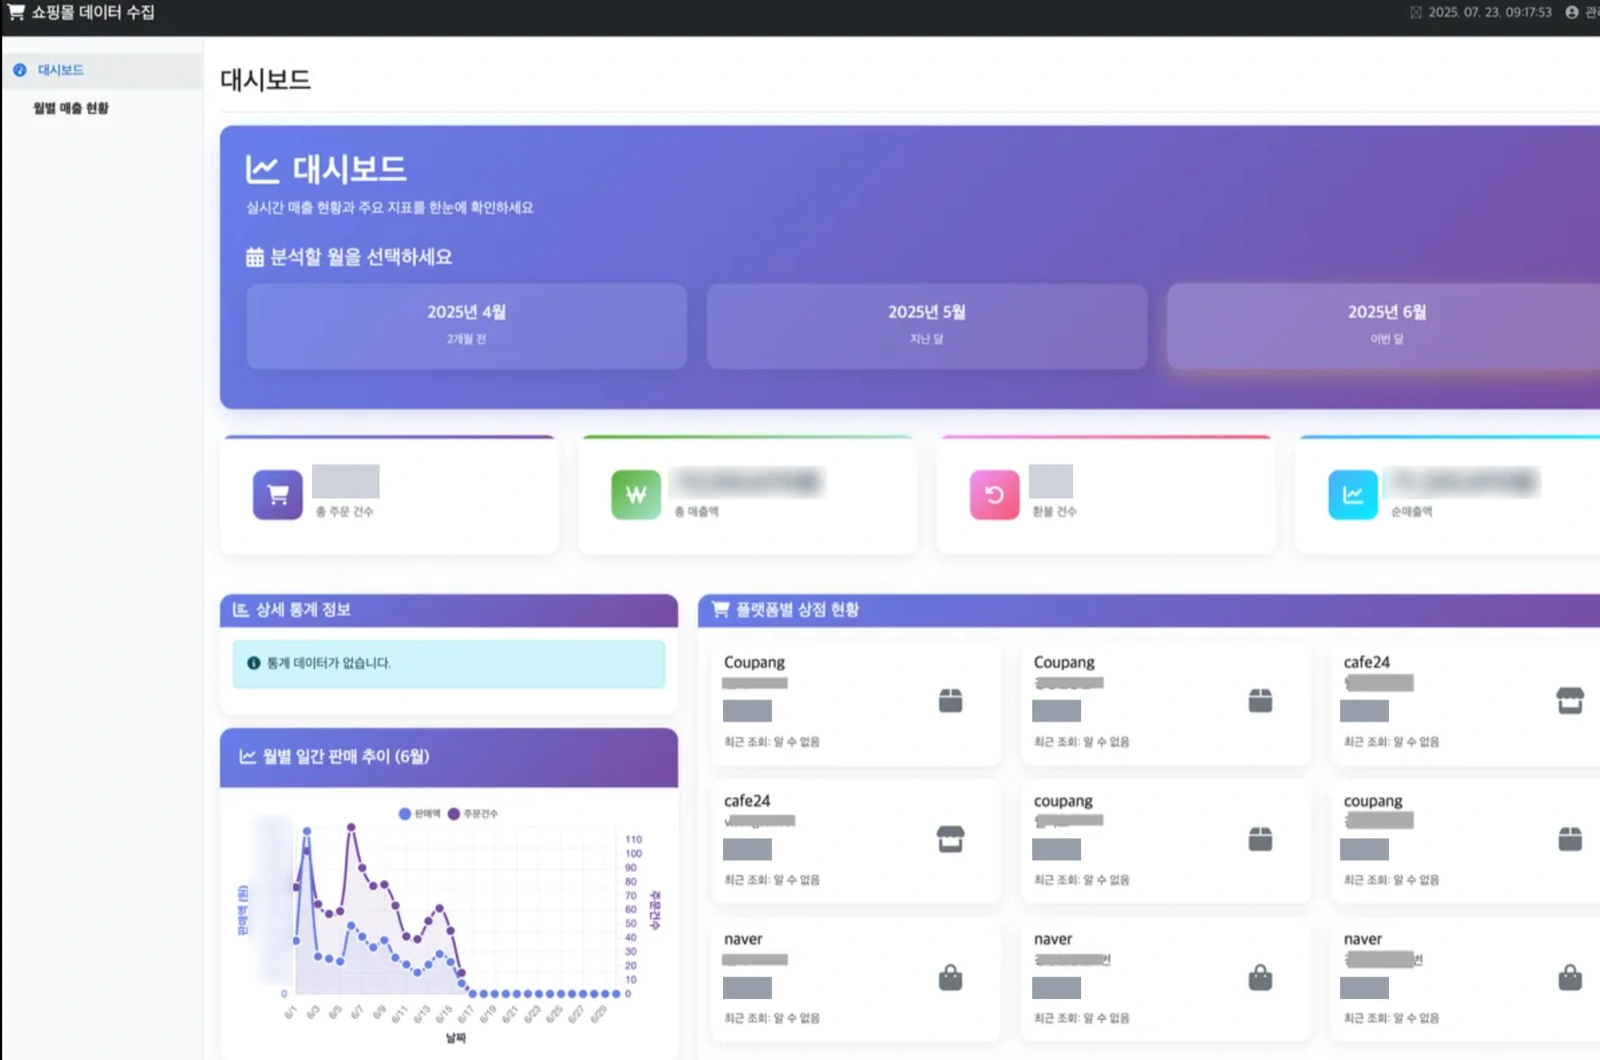
Sales status scattered across Coupang, Naver, and Cafe24 in a single screen
Order data that used to be fetched by logging into each store was automatically collected across three platforms, aggregated on a common standard, and gathered into a single screen.
Sales status check 3 platforms · separately per store from single screen · automatic collection to
-
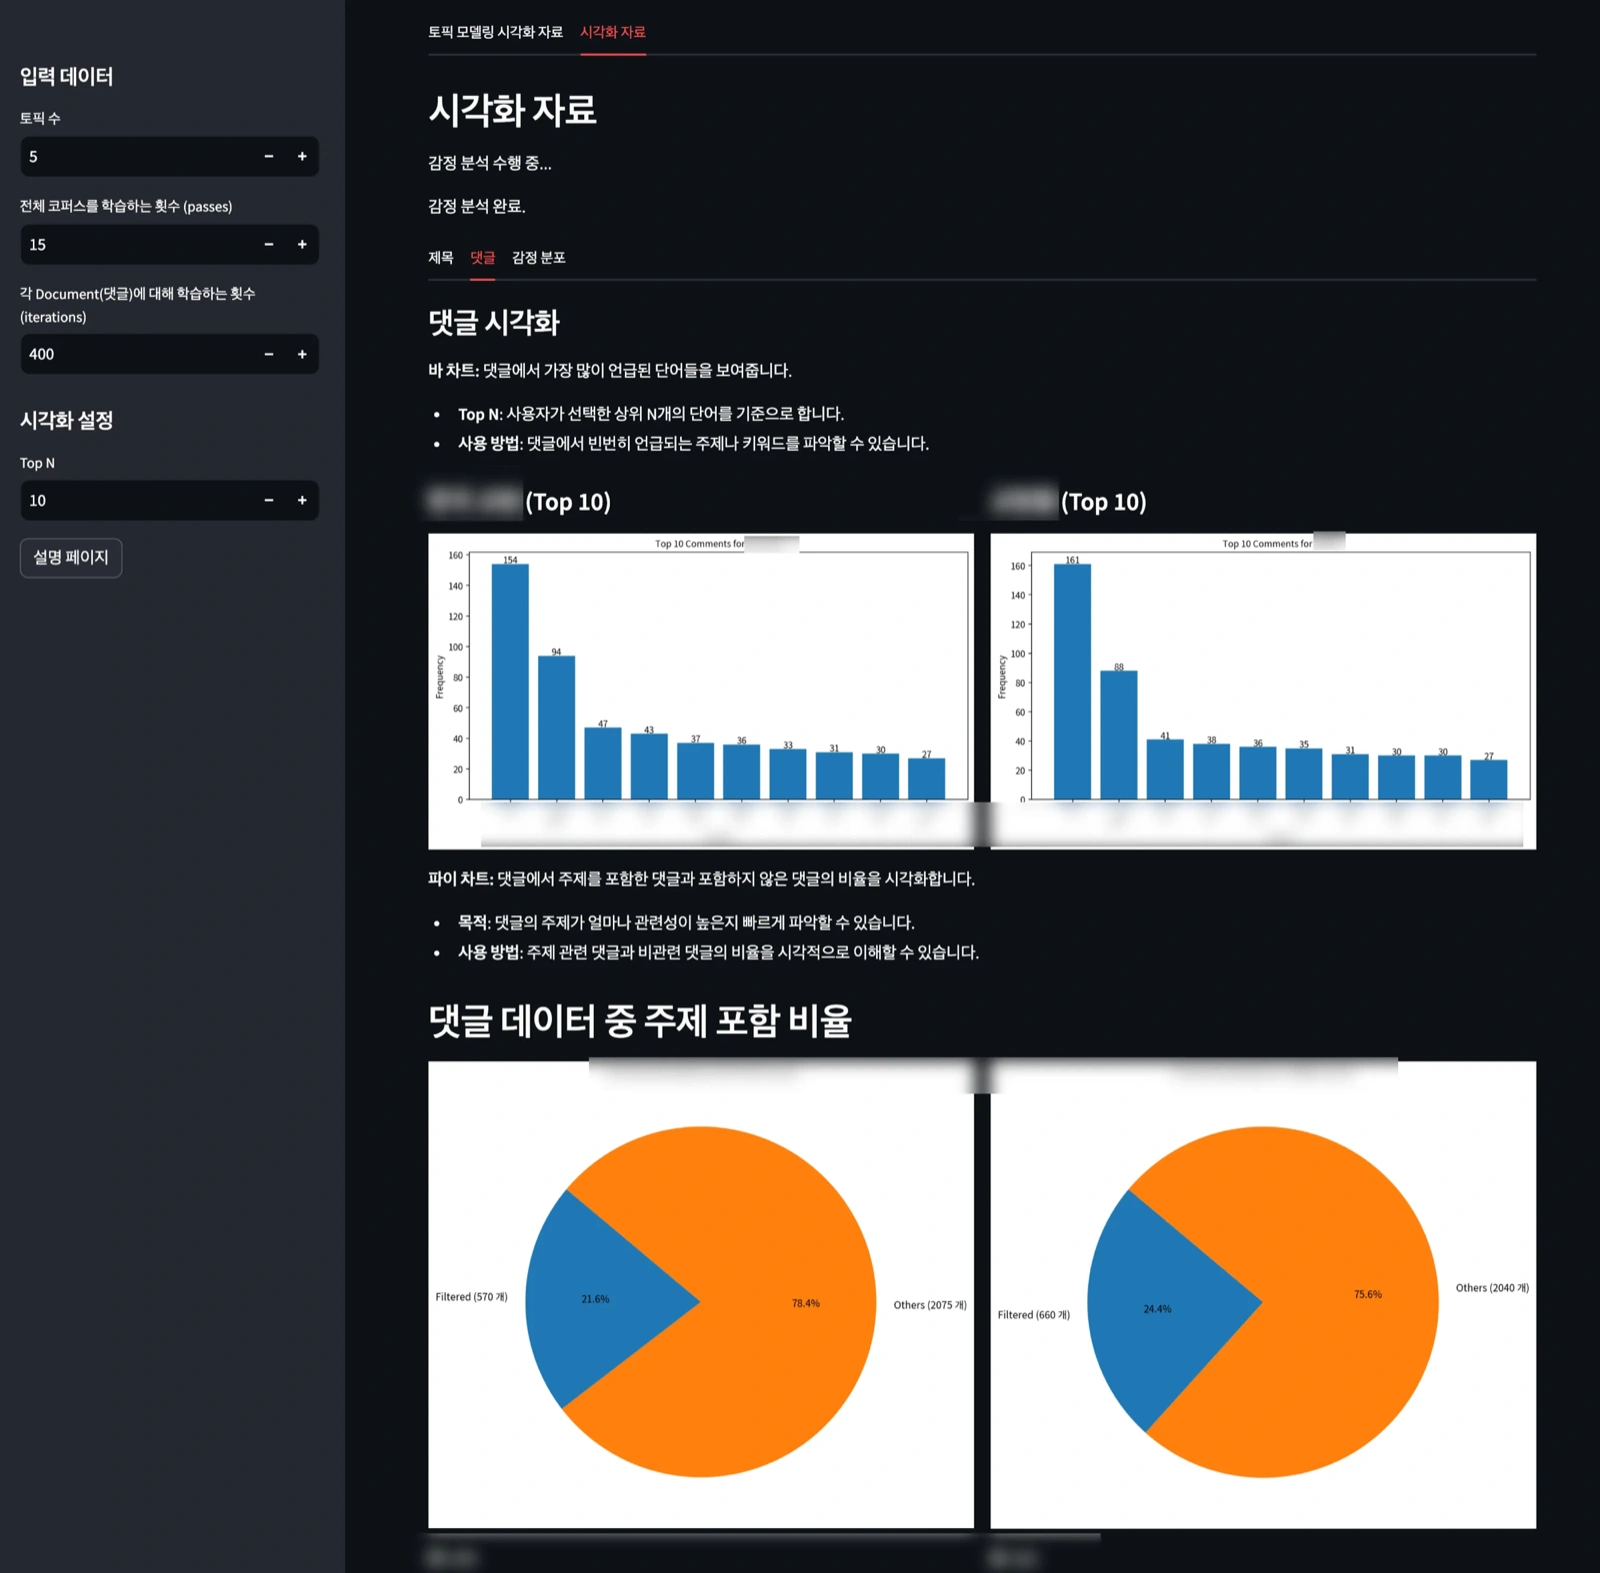
An analysis tool that shows thousands of research comments split by topic and sentiment
Video comments gathered by search term are grouped by topic, with a positive/negative distribution alongside. How many topics to split into is decided by the researcher on screen. It was built so the researcher can change the criteria and re-run it themselves.
Understanding comment topics By skimming with the eye and guessing from By per-topic, per-sentiment distribution to
-
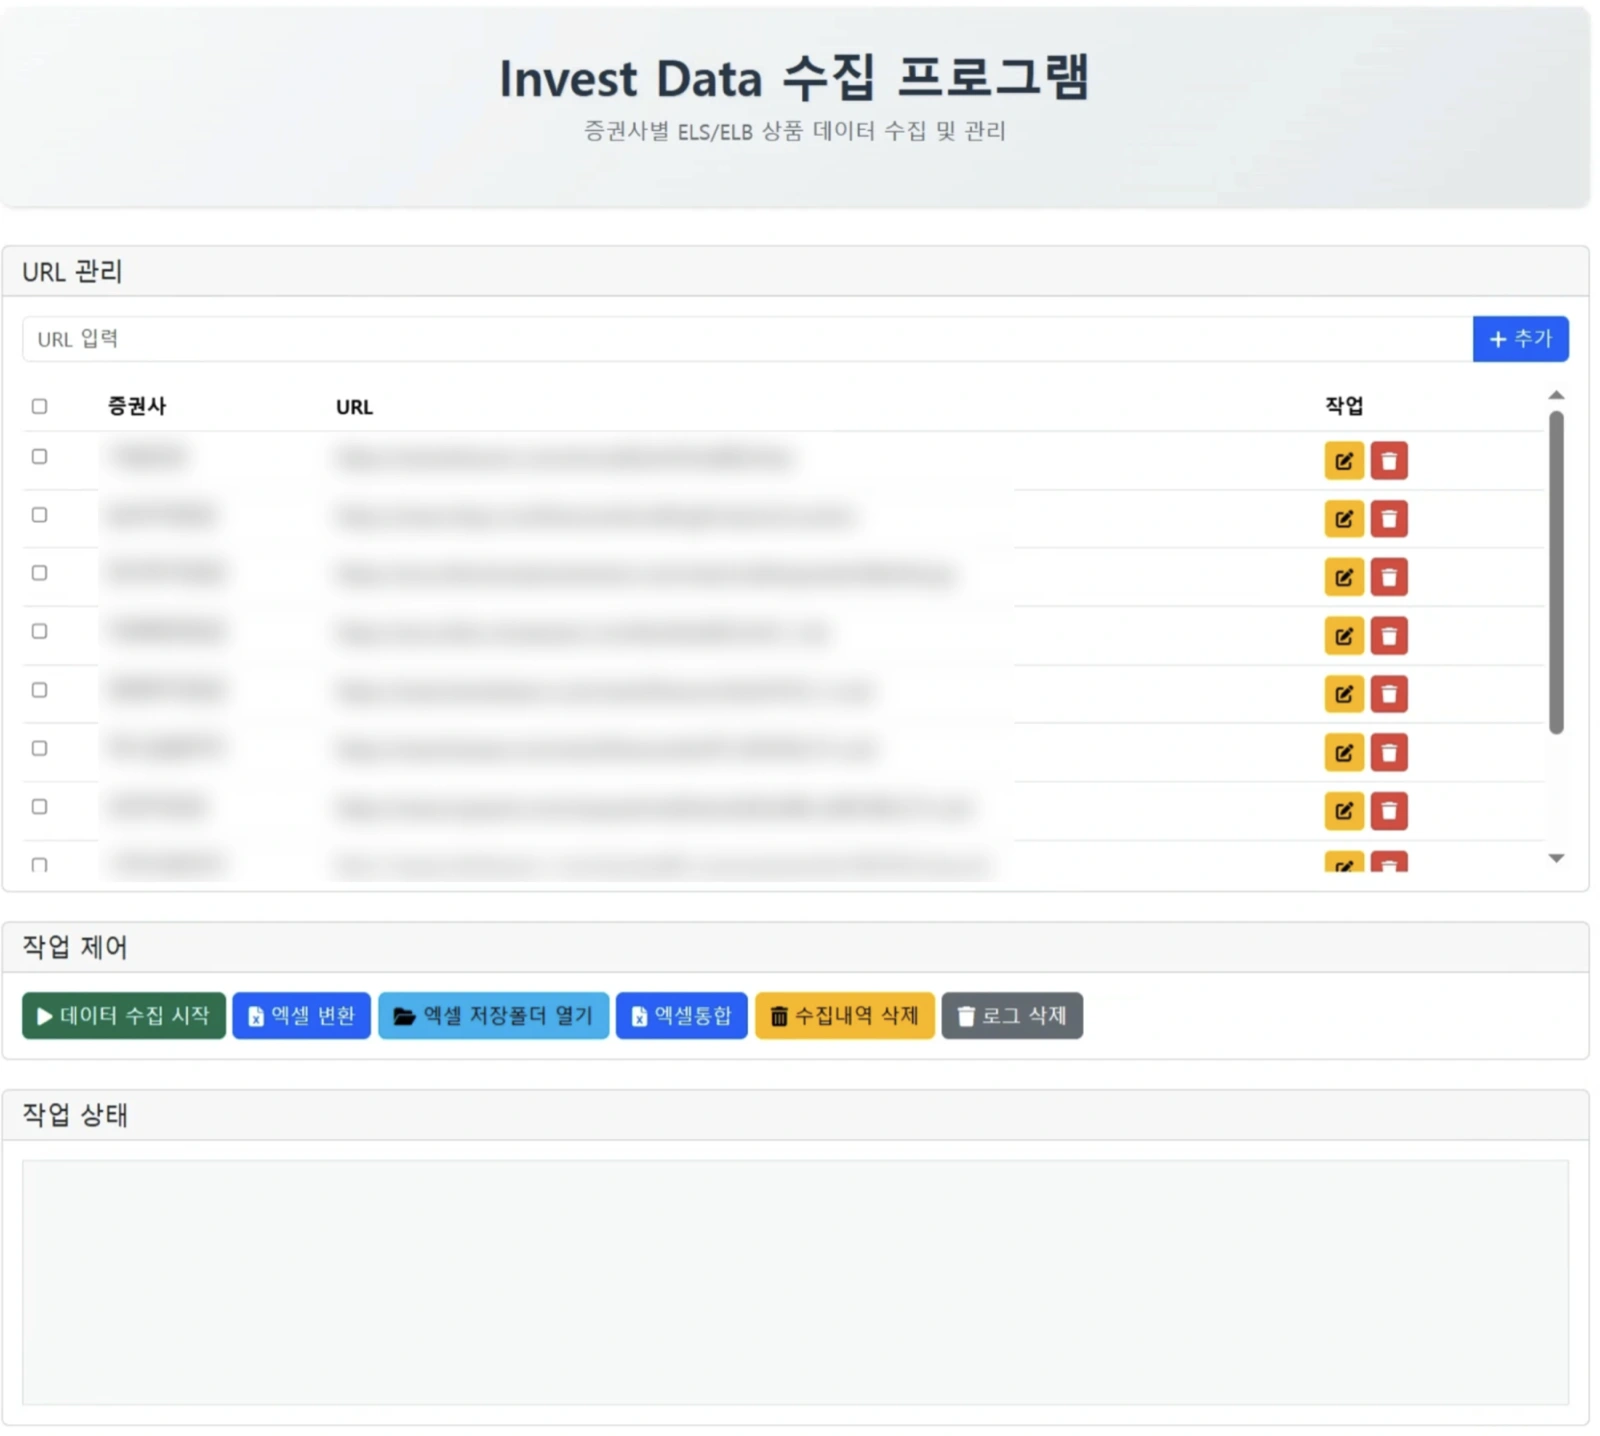
Derivatives-linked securities disclosures scattered across securities firms, as one comparable table
Automatically gathers ELS·ELB product information from each securities firm, splits product structures written in sentences into columns for maturity, period, and early redemption conditions, and puts them in one table.
Product comparison Checked separately per securities firm from Compared by condition in one table to
Frequently asked about this topic
- News monitoring automation — get articles that mention your company as soon as they appear The short answer: collecting keyword news automatically and getting notified is very much doable. Three things to choose, four things to decide.
- Transcribing into Excel can be automated — 3 criteria to tell The short answer: anything that follows fixed rules and repeats is a candidate for automation. What looks special is usually just rules that haven't been written down yet.
What we don't do.
We don't turn what we haven't measured into numbers. When there is no basis to count, we write that fact instead of assigning a score. It is for the same reason that only one case on this site states time saved — the rest have no measurement record.
If gathering data is needed before the analysis, Web data collection or App crawling is the place for it.
We start by deciding together what to count.
Tell us about the data you are currently comparing by eye and the criteria you judge by, and we'll first check whether it can be counted by the same criteria.
Replies within 1 business day