A collection and scoring system that stops you from picking creators by eye
Influencer profiles are collected automatically, scored with quantitative metrics alone, and divided into grades. The criteria judge — not the picker's gut feel.
Creator screening
Before
Metrics compared by a person
After
4 quantitative items summed · grade computed
Background
Picking creators is usually done by gut feel. If someone looks like they have many followers, they look good; if comments look active, they look even better. But what “looks” good differs from person to person.
The problem we defined
Automating collection is only half of it. If the criteria live only in someone’s head, it’s hard to explain why a creator was rejected, and the same decision can’t be repeated next time. What to look at when choosing must be written on the screen so that the same conclusion is reached even when the person changes.
What we built
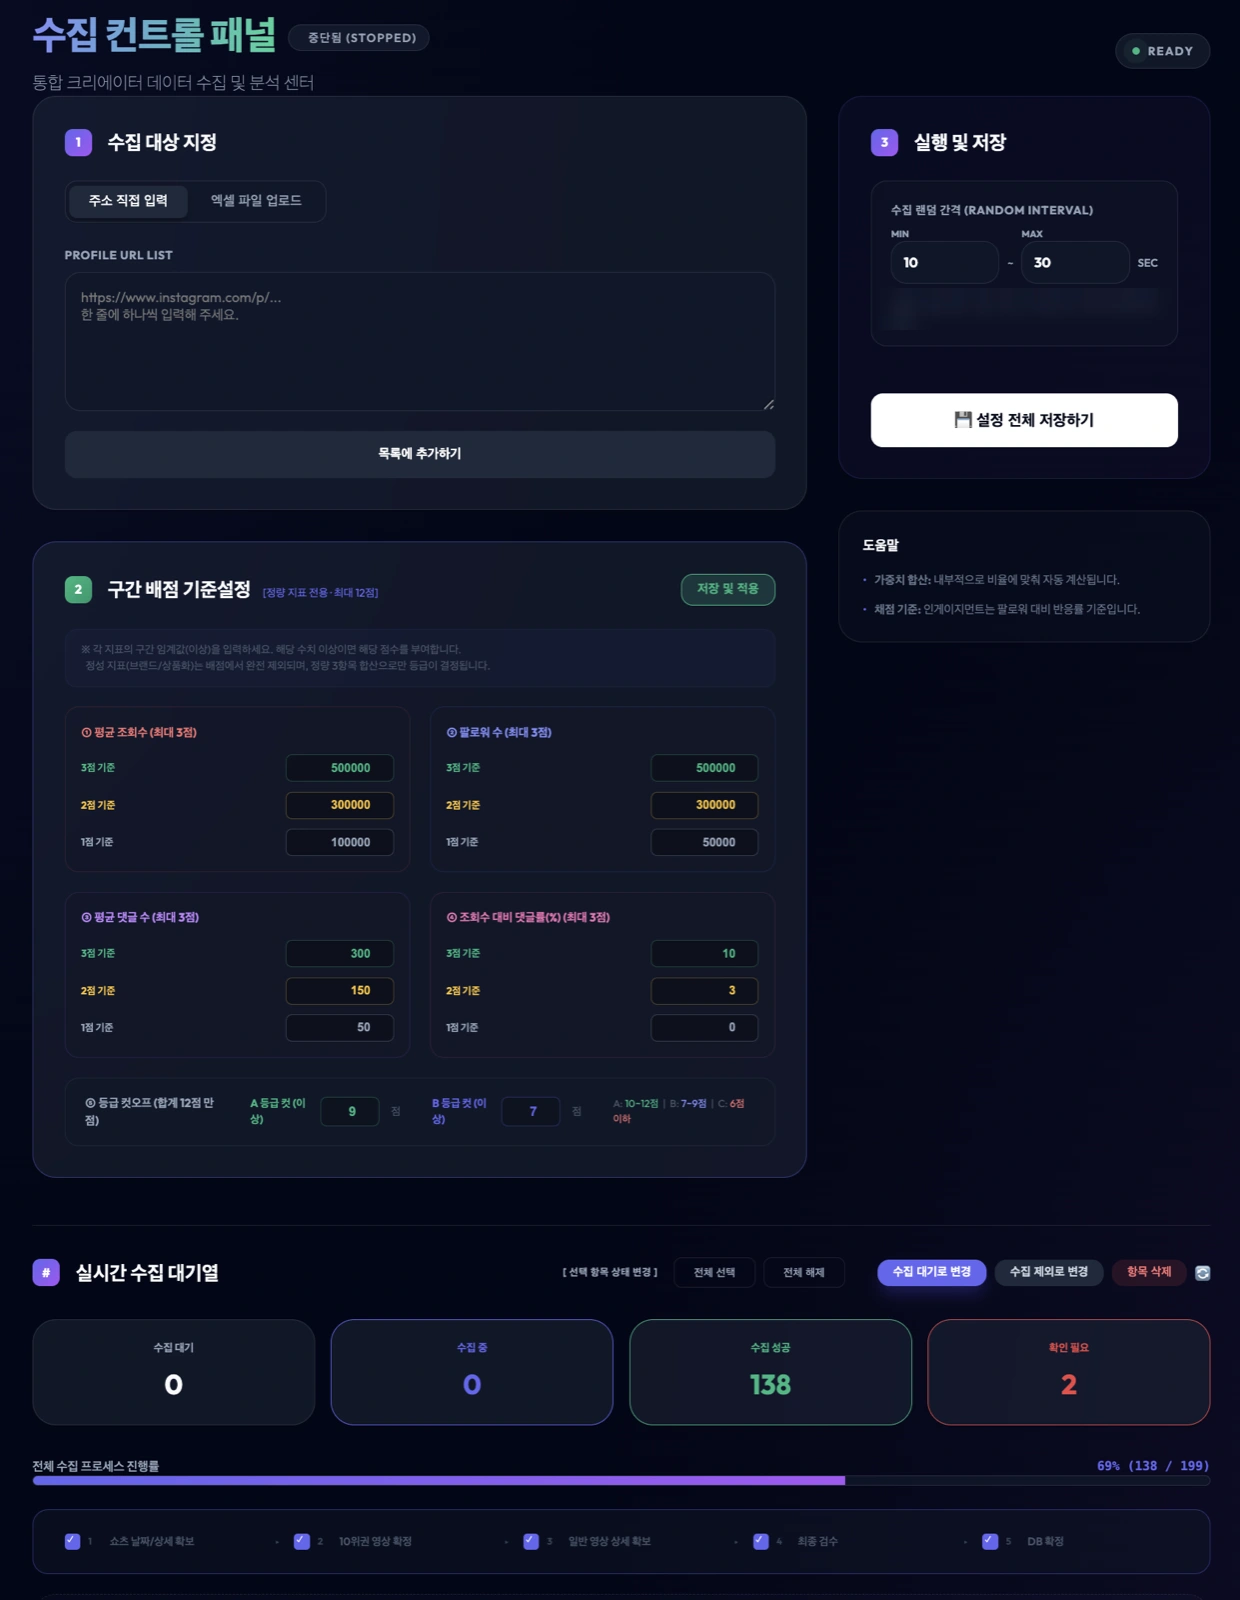
- Two platforms in one window — Instagram Reels and YouTube videos. Instead of running each platform separately, you see targets and status in one place
- Automatic profile collection — paste an address or upload an Excel file, and it builds a list and goes through it
- Scored with quantitative metrics only — average views, follower count, average comments, and comment rate per view. Each of the four items gets per-range scores that are summed into a grade. Qualitative metrics like brand image are left out of the scoring entirely — mixing in things that can’t be counted in numbers puts the criteria right back inside someone’s head
- Criteria changed on the screen — the person in charge adjusts directly at what score a creator becomes A, and at how many views an item gets 3 points
- Collecting with pauses — it rests a random time between 10 and 30 seconds per task. Not rushing is what fills the candidate list to the end without breaking off midway
- Progress shown as-is — waiting, collecting, success, and needs review are counted separately, and failures stay visible
Collection runs only with an account to which the client has access rights.
Why we built it as a browser extension
Instead of putting it on a server, we built it as an extension that runs inside the person in charge’s browser. With a server, account information has to be stored somewhere, and the moment it’s stored, there is something to protect. As an extension, it uses the already-logged-in browser as is. The account stays in the person in charge’s hands.
Results come out as an Excel file.
Result
Built and delivered in about 1.5 weeks. Put in a candidate list and metrics get filled in, and grades are attached according to the criteria you set.
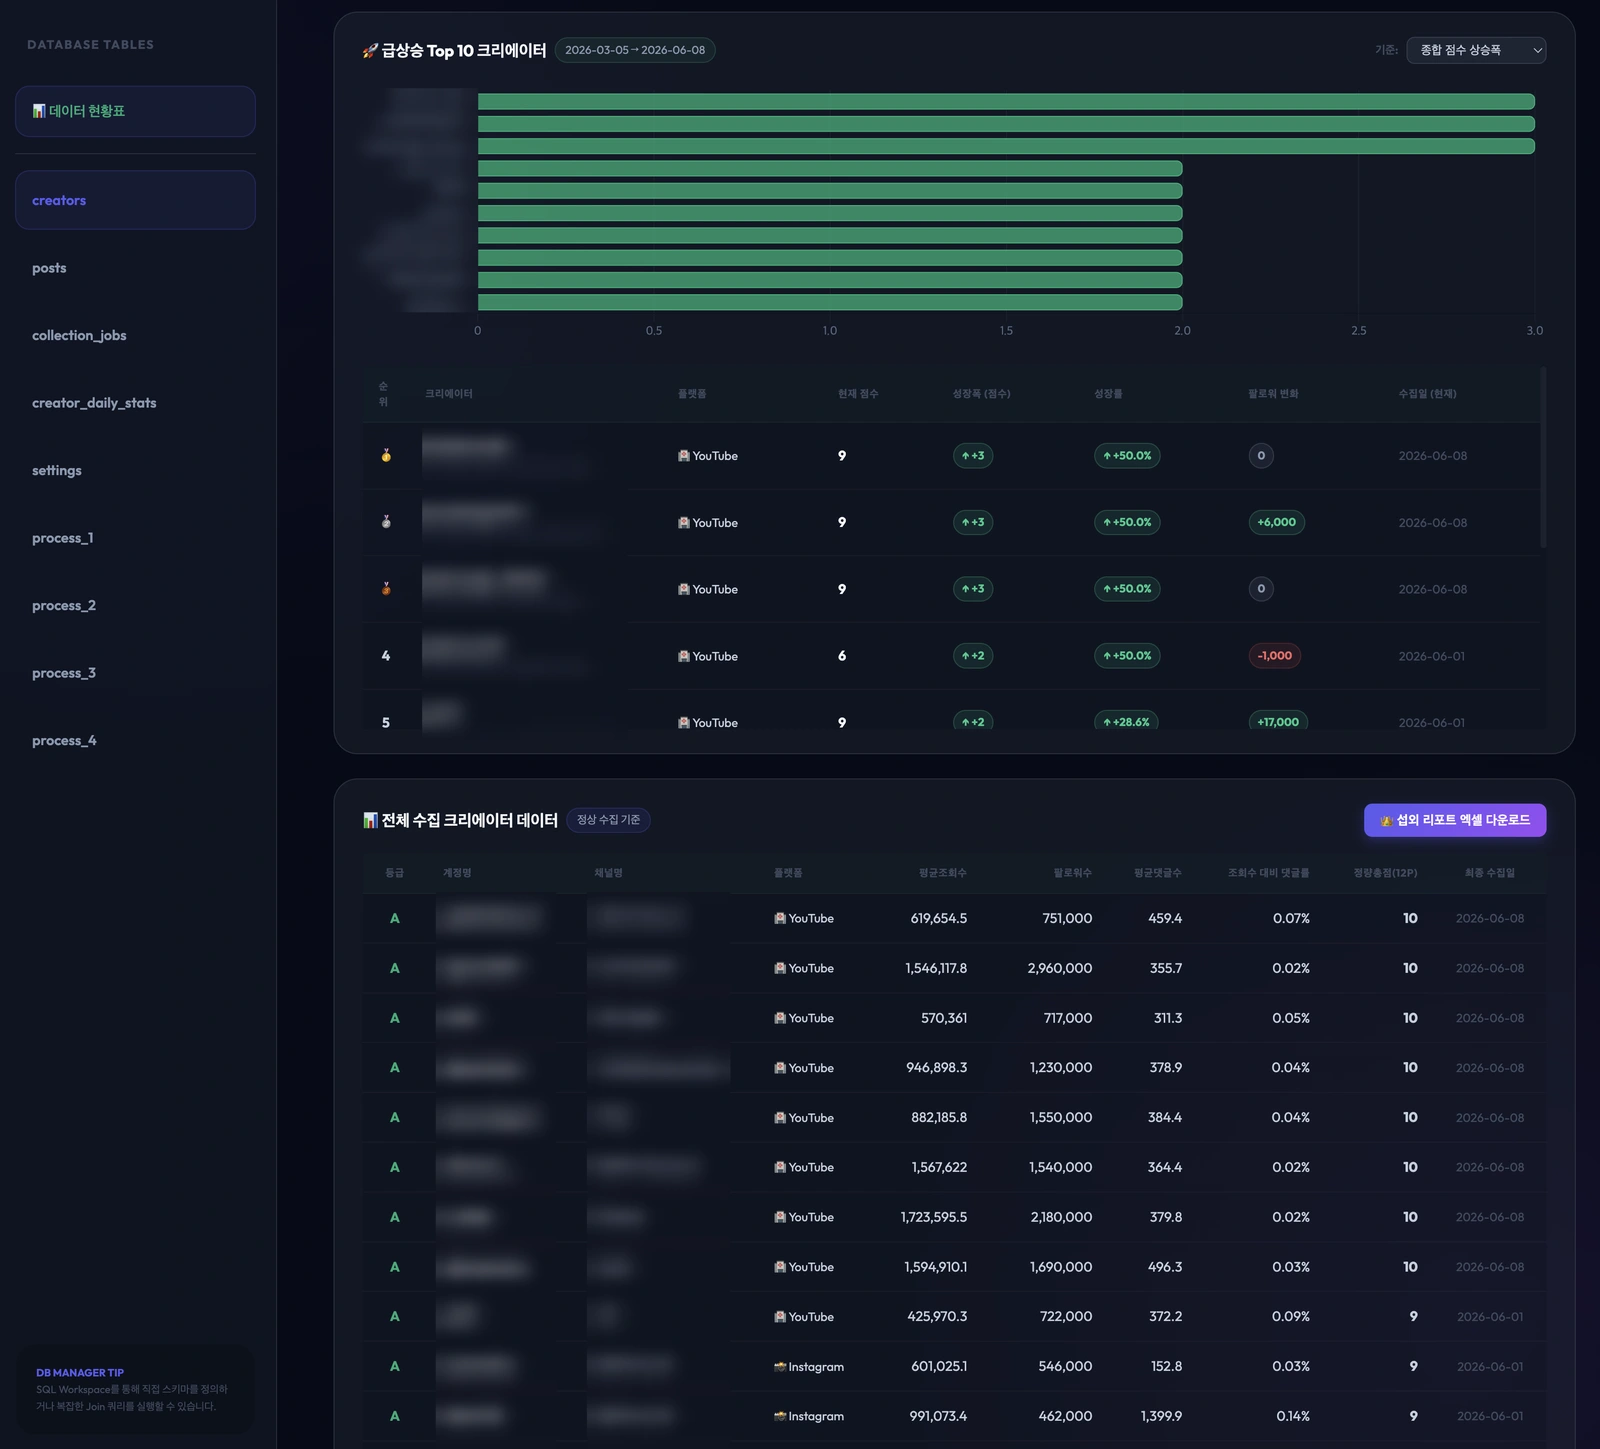
When you set a period, the creators whose scores rose the most in that time move to the top. Account names have been masked.
Other work built the same way is collected at web data collection.
Other work on the same topic is collected at data analysis.
Cost by collection scale and difficulty — Data collection pricing
Sources
Delivered system screen